顯示具有 zabbix 標籤的文章。 顯示所有文章

2019年4月6日 星期六

Top 5 open source network monitoring tools

Prometheus
Prometheus is an open source network monitoring tool with a large community following. It was built specifically for monitoring time-series data. You can identify time-series data by metric name or key-value pairs. Time-series data is stored on local disks so that it's easy to access in an emergency.
REF: https://opensource.com/article/19/2/network-monitoring-tools

2019年3月8日 星期五

LM: Real-time performance monitoring with Netdata

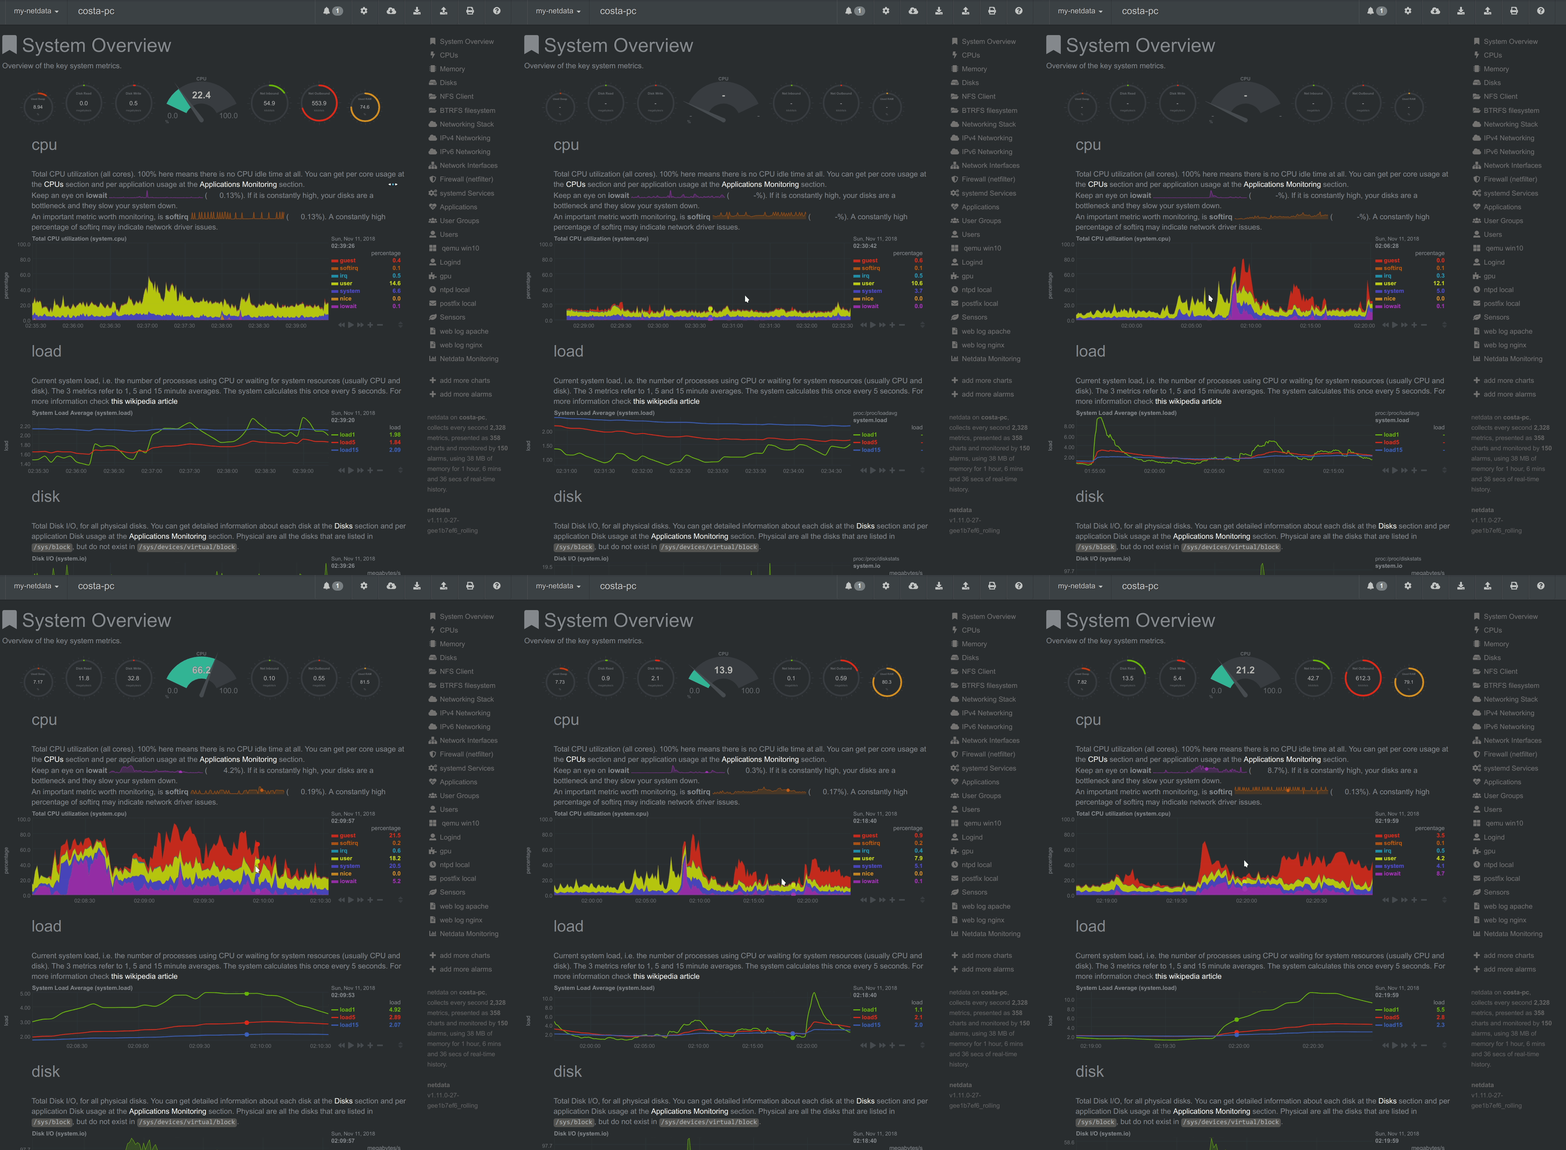
peek 2018-11-11 02-40
A typical netdata dashboard, in 1:1 timing. Charts can be panned by dragging them, zoomed in/out with SHIFT + mouse wheel, an area can be selected for zoom-in with SHIFT + mouse selection. Netdata is highly interactive and real-time, optimized to get the work done!
REF: http://www.linux-magazine.com/Issues/2019/221/Netdata

2018年10月12日 星期五

Monitoring system on OpenBSD

---------- Forwarded message ---------
From: Tom Smyth
Date: Fri, Oct 5, 2018 at 11:13 AM

Librenms would be worth a look i believe it has email alerting
and snmp support needs php and mysql
Zabbix   ...havent used this one but it has monitoring functionality ...
If you are monitoring alot of systems, make sure your storage can
cope with alot of I/O or you will see annoying gaps in your graphs
so use SSDs and make sure that when formatting the system
that you align with 1MB offset ...  2048 sectors  (instead the default
64 bytes)

Peace
Tom Smyth

2017年8月6日 星期日

Check_MK: netstat

Established TCP Connections or TCP/UDP Listeners
Distribution:official part of Check_MK
License:GPL
Supported Agents:Linux, AIX
This check evaluates the output of the netstat command on Linux and AIX and checks if there are established connections or listeners matching a given criteria. 
The check returns OK state if the specified connection/listener is present, and CRIT if not. 
This check needs the agent plugin netstat_an.bat to be installed. 
REF: https://mathias-kettner.com/checkmk_check_netstat.html

2017年2月10日 星期五

Check_MK: Downtime setup

Downtime setup can be processed during event alerts. for example 'Event of service XX, YY host'. Then the orange alerts on main page will disappear temporarily according to the time period. Another way is to 'Acknowledge' the alert, and it will vanish from the 'Unhandled' orange alert but service alert stays.

2017年2月7日 星期二

Check_MK: mkeventd err

If you have enabled Event Console but sometimes receive errors on distributed sites about 'mkeventd:...contact group not found', just goto Global settings then disable notification to Event Console group. Save and apply but error again, then enable it again. ALL done. Seems like just a bug.

2017年2月4日 星期六

Check_MK: Discovery & Alerts

許多monitoring solution沒有auto discovery與專門的alert engine,設定起來會花些時間。

針對不同開發專案,Nagios based 如 Check_MK 可直接設定一個distributor site給這個project用,大概兩個小時。每台server裝個agent大概五分鐘,可以auto discovery本機十幾二十個左右的常見matrix如CPU, memory之類的,特別的服務才需要寫script.

alert policy可針對services, host, contact group分別定義,其實大家都很忙,除MIS之外,其他人大概只會看alert。

REF: http://mathias-kettner.com/check_mk_multisite_screenshots.html

2017年2月3日 星期五

Check_MK: Event Console

Event Console MUST be enabled in 'omd config' before any 'proactive' actions can be set as response for service alerts. The EC config button will appear in WATO then. Action can be set in its setting following the official reference 'Integration with Nagios; 'step-by-step, playing as a role of event handler.

REF: https://mathias-kettner.de/checkmk_mkeventd.html

2017年1月30日 星期一

Zabbix: compile agent

Zabbix agent is useful for pulling or pushing checks on many platforms, which is a general all-in-one solution for monitoring. Although Nagios can also achieve similar features, it requires further understanding of its modules (plugins and addons). Modular design may be useful in heterogeneous environments.

$ ./configure --enable-agent

You may use the --enable-static flag to statically link libraries. If you plan to distribute compiled binaries among different servers, you must use this flag to make these binaries work without required libraries. Note that --enable-static does not work under Solaris.

2017年1月29日 星期日

Check_MK: NSCA push checks

In some cases we need to push checks from client to server, for example dynamic ip, behind firewall, etc. NSCA service of Nagios Addon is useful for such case, which can be turned on via 'omd config'. However, if you have many such push hosts, using Zabbix with its native passive poller via agent may be a better choice.

freshness can also be checked via WATO->Host & Service Parameters->Active Checks-> Classical...

REF: http://users.telenet.be/mydotcom/howto/nagios/nscaclient.html

Test and tweak

On a linux system, you can test your send_nsca by running something like this (where nagiosserver is the FQDN of your nagios server) :
 echo -e "localhost \ttestservice \t0 \tTEST " | send_nsca nagiosserver  
On the Nagios server, look in syslog or /var/log/nagios/nagios.log : you should see a mention that nagios received your message, and a complaint that it can't process the service check result because the service doesn't exist. That's because you did not define service "testservice". But it confirms that your nsca setup works.
REF: http://lists.mathias-kettner.de/pipermail/checkmk-en/2013-March/008780.html

CHECKMK MULTISITE CONFIGURATION
1) In WATO go to "Host & Service Parameters" >> "Active Checks" >>
"Classical active and passive Nagios checks"

2) Create a new rule in which the "Service description" is the same name
that is going to receive the NSCA information.  (This name would also be
configured on your NSCA agent on the client being monitored.)

3) Make sure the new rule only applies to the hosts that will be receiving
the NSCA information.  This can be done via tags or by explicitly
specifying host names.  I prefer tags as that way I can just set up a new
host with the correct tags and it will automatically get the new NSCA
Service added to it's checks.

4) In the "Command line" checkbox of the new service, I put something like
this
'echo "ERROR - you did an active check on this service - please do not do
that on this service" && exit 1'.
(This is similar to what MK is doing with CheckMK passive checks in the
CheckMK template file.)

5) Go back to the Main Menu for "Host & Service Parameters" (The Rule
Editor)

6) Go to "Monitoring Configuration"

7) Create a new rule under the section "Service Checks" in the category
"Enable/disable active checks for services"

8) Make sure this rule specifies the Service name that you created back in
step 2 and set it to "Disable active checks".

9) Apply the changes in WATO

It is important to note that at this point, you have now created a Service
for a host (or hosts) that is not actively being checked and is just
sitting as a passive check.  This is good because it will allow NSCA to
pass status information for the Service back to Nagios.


2016年2月13日 星期六

IT監控系統的選擇(續)

承上篇,若從人力財力的角度來分類,可以得出以下小結:


  • 有錢有人,可以考慮發展Splunk,或Nagios XI,或Zabbix。就根據組織對彈性與內建功能之間的平衡如何拿捏了。
  • 有錢沒人,可能從內建較完整的Zabbix開始吧。雖然Splunk可以包給廠商做,但要刻的東西不少喔,沒人後續維護的話,會很麻煩。
  • 沒錢有人,Cacti,或Nagios,或Check_MK,接著再花人力刻出要的功能吧。或是直接用Zabbix應該也行,但系統資源要比較夠力一點。
  • 沒錢沒人,大概只剩Check_MK的自動功能可依賴了,而且他基於Nagios的本質,資源消耗也較少。若監測的環境較小,Cacti或Nagios的少量template也堪用。

2016年2月12日 星期五

IT監控系統的選擇

選擇的依據,不外乎:公司要求的,自己喜歡的,人力與財力負擔得起的。總之,最後還是用的順手最重要,以確實達到即時「監控」的目標。

  • 公司要求的
公司已經有既定的傳統,就照著發揚光大吧。主要原因,是該系統的know how應該已經累積不少了,客製化監測,教育訓練,作業SOP等等,這些都需要時間去建置,並且不容易直接從外部導入的珍貴資產。

  • 自己喜歡的
你會看這篇文章,大概因為你是被指定要建置監控系統的承辦人。那麼為了讓這件工作更有趣,找個自己喜歡的系統玩玩吧。至少自己喜歡,學習跟維護的熱情會比較大,這也是系統能夠成功的關鍵因素之一。

  • 人力與財力負擔得起的
公司的規模,老闆的口袋,團隊的質量,都直接影響到IT監控系統的選擇。就像開船一樣,大船承載能力強,但需要水手多,耗材多,而小船雖然成本都低,但承載力不盡人意。從管理的角度來抓出最適當的平衡,就很重要了。


以下就從這個面向,來談談幾個我用過的系統。

  • Cacti
很多網管是從這個入門的。他最大的優點是資料視覺化 (data visualization) 很方便,並且使用RRD作為資料格式,儲存空間需求低,對於需要進階分析 (analytics) 的團隊很好用。然而他 data fetching (採資料) 的能力稍弱,主要靠SNMP,還有自己客製的script。這是兩大煩惱:SNMP template 很多需要自己刻 (有團隊就派給專人刻),寫script也要花時間 (有專人最好),可怕的是當你監測很多主機時,script的效率,Cacti的負載就面臨考驗了。所以最好是把 data fetching 交給別的系統做,Cacti做好最擅長的 visualization 就可以了。

那麼 SNMP template 可以考慮嗎?見仁見智,如果你用過能夠做 auto discovery (自動列舉) 的系統,大概就不想自己刻了。並且 SNMP 是否足夠安全,也是需要考量的。有些系統則是發展自己的 agent (代理程式),既有自己的傳輸協定,又能像SNMP一樣大把抓資料。以下要談到的系統,通通有agent可以用。

  • Splunk
有錢有人的話,Splunk是個很好的選擇。他的 log analyzing (log分析) 很強,又可以分散式部署,visualization也很好用,template也一大堆,客製的彈性也大,社群與商業支援也很多,你能想到的他大概都想到了。但Splunk就是得花錢買,而且要調的東西很多,不是自己僱人做就是買人家的support,而且主機資源也不能太少, Splunk agent (Universal Forwarder) 跟主程式都要夠力的硬體才跑的好,畢竟他要做的事情很多很全面嘛。

  • Nagios

想打好自己做監控的基礎,Nagios不可或缺。沒摸過的話,市面的書不少,先抓幾本來看,不要急著裝起來。Nagios的設計有極簡約的美,core, plugins 各自做好自己的事,但若你不瞭解他的運作原理,裝起來只會呆掉無從下手。Nagios能調的地方非常多,外掛的功能也超多,就怕你自己不知道要監測什麼--沒錯,你得先規劃好自己的監測架構才行,然後才用Nagios組合出你要的架構,就像堆積木一樣。美中不足的是,Nagios 著眼在警報,若你想要 visualization,一定得自己外掛。如果你沒時間想沒時間做,不建議用Nagios Core,而是用商業版的Nagios XI,或Check_MK,這些基於Nagios但已經幫你架構好的監控系統。

Nagios也有個好用的 agent 叫 NRPE,很輕量,但你也得自己告訴他要去check什麼東西才行。 總的來說,Nagios的優點就是到處都能調。

  • Check_MK
如果你想要輕量如Nagios,又沒時間從頭做,Check_MK會是很好的選擇。他在Nagios的基礎上,掛好了RRD的data fetching與visualization的功能,並且也有自己的agent,會幫你做auto discovery,自動列舉主機需要監控的項目。支援的OS種類繁多,也支援SNMP亦有auto discovery (弱一些)。可惜的是文件不多,得自己K官網文件與系統說明了。

若想進一步客製化圖表,把RRD導給Cacti進一步處理,會是不錯的做法。
  • Zabbix
這個系統我是最近才裝起來看的。功能很多,能調的東西也很多,agent也有,不愧其名號 enterprise-class open source monitoring solution。但是啊,既然是enterprise,就算系統不花錢,僱人來調來維護也是必要的。這樣的話,用Nagios不就更有彈性嗎?若還有點預算,買Splunk不更全面嗎?若主機少一些,Cacti的SNMP大概就堪用了。所以,這個系統尚在觀察中,至少其龐雜的體系,值得其他系統借鑒。要說內建功能最完整的監控系統,Zabbix應該當之無愧。端看你是要彈性,還是內建功能齊全。