 |
2020年3月14日 星期六

2020年2月17日 星期一
Cloudflare: New tools to monitor your server and avoid downtime

2020年2月10日 星期一
Cloudflare: Introducing the GraphQL Analytics API: exactly the data you need, all in one place

REF: https://blog.cloudflare.com/introducing-the-graphql-analytics-api-exactly-the-data-you-need-all-in-one-place/
Announcing deeper insights and new monitoring capabilities from Cloudflare Analytics

REF: https://blog.cloudflare.com/announcing-deeper-insights-and-new-monitoring-capabilities/
2020年1月30日 星期四

2020年1月21日 星期二
Cloudflare: Introducing Load Balancing Analytics

2020年1月16日 星期四
ADMIN: Storage monitoring with Grafana
Create intuitive and meaningful visualizations of storage performance values with a "TIG" stack: Telegraf, InfluxDB, and Grafana.
REF: http://www.admin-magazine.com/Articles/Storage-monitoring-with-Grafana
2019年10月18日 星期五
Cloudflare Browser Insights
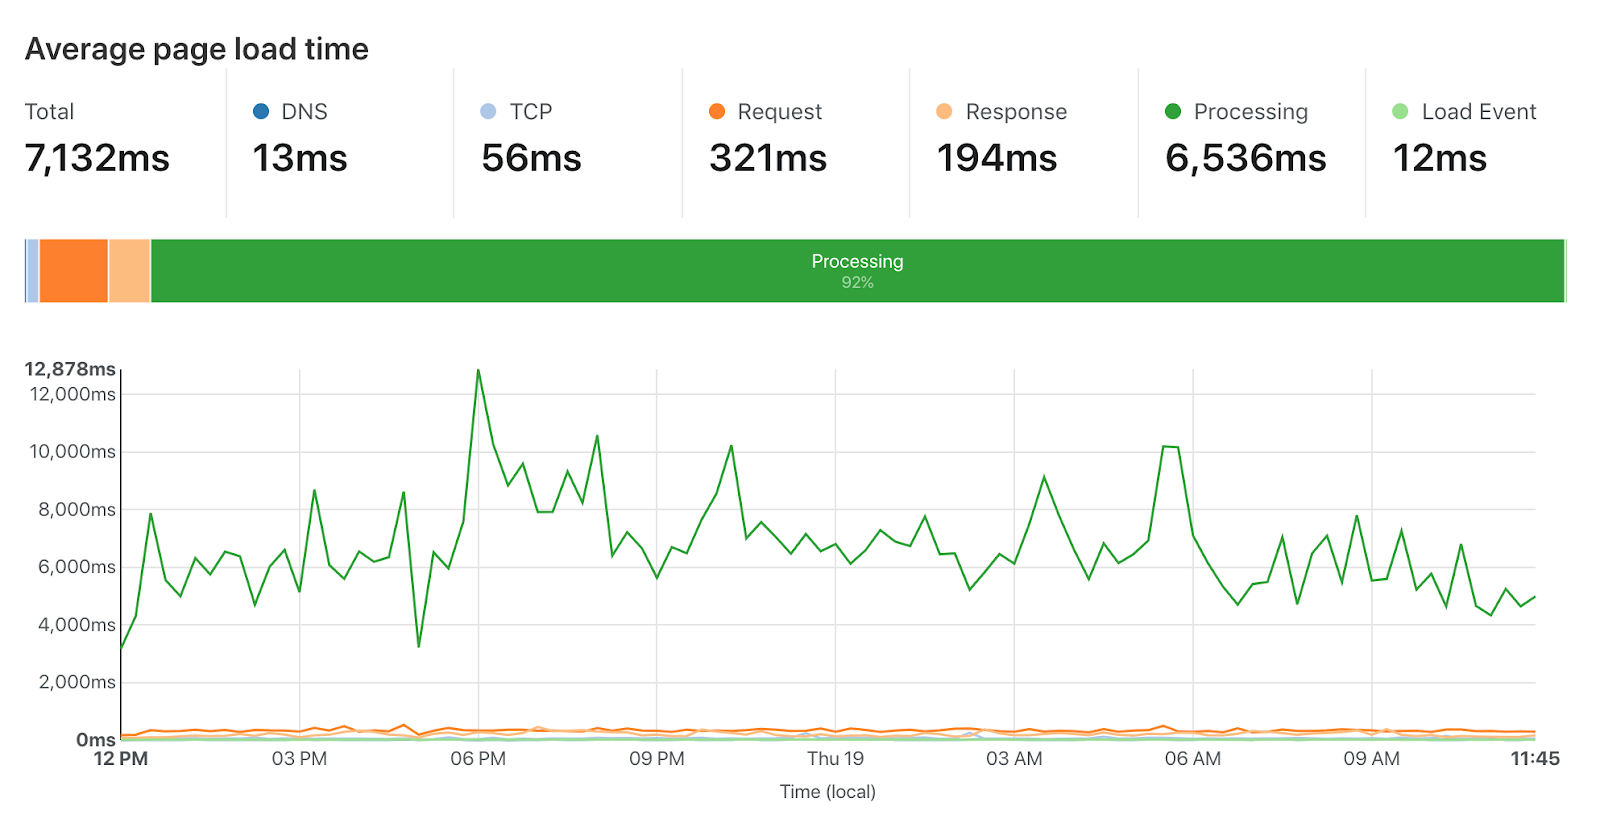
There’s a lot of info in this graph! At a high level, there are two main types of metrics
- Request-level metrics like TCP connection time, or Request time. These metrics are counted on every page load and are impacted by Internet infrastructure, like the mobile network of your end users, or the speed of your servers.
- Page-level metrics like Page Load Time, which take into account the many requests needed to load a web page, plus the time taken to parse HTML and execute JavaScript.
2019年1月18日 星期五
ADMIN: Installing and operating the Graylog SIEM solution
 Figure 1: Graylog comprises a web interface, a server, MongoDB, and Elasticsearch.
REF: http://www.admin-magazine.com/Articles/Installing-and-operating-the-Graylog-SIEM-solution
2018年10月27日 星期六
Discover the latest updates to Google Analytics
|

| NEW FEATURES |
 |
Cross Device Features Now Available
A few months ago we introduced new Cross Device features to help you gain visibility into the journey your customers are taking across their devices as they interact with your website. To use these features, start by visiting the Admin section of your Analytics account and choose the setting to activate Google signals.
|
2018年9月5日 星期三
Graylog leads the latest Info-Tech SIEM Category Report
|


|
2017年10月26日 星期四
Splunk ITSI 3.0 Modernizes Event Management
Splunk IT Service Intelligence (ITSI) 3.0 delivers inbuilt machine learning, so your team can find actionable events and respond to business-impacting issues faster.
Learn how Leidos, a Fortune 500 global science and technology leader, replaced its ineffective event management solution. The company now uses correlations and rules engines in Splunk ITSI 3.0 to better manage and prioritize its flood of events - so it can fix the most important issues first.
2017年8月26日 星期六
Check_MK: Backup and Restore
What happens at Backup & Restore
The following files and directories go into your backup - and will be replaced completely by a restore:
- the main configuration file (main.mk)
- the final configuration file final.mk, if present
- all files in your configuration subdirectory conf.d, if present
- automatically inventorized checks (usually /var/lib/check_mk/autochecks)
- current performance counters (usually /var/lib/check_mk/counters)
- stored logfiles of logwatch (usually /var/lib/check_mk/logwatch)
- cached files from the agents (usually /var/lib/check_mk/cache)
REF: https://mathias-kettner.de/checkmk_backup.html
2017年6月18日 星期日
2017 mass media conference
- digital data controlled by large companies.
- only web related data available in recent years.
- case study of OTT, both behavior and marketing analyses.
- Netflix not so well in Taiwan.
Upgrading Cacti
from 0.8.8 to 1.1.7:
- UI will fo Pre-installation Checks. Fix all problems.
- Timezone needs to be set in php.ini: 'date.timezone =America/Regina'.
- incompatible plugins, e.g. syslog, etc, will be disabled automatically.
- mobile UI is available in the latest version.
2017年6月9日 星期五
New Check_MK stable release 1.4
Changes in all Check_MK Editions:
WATO:
* 4747 FIX: Fixed resetting global settings to factory defaults
* 4750 FIX: Ensure uploaded icons are saved with their filename instead of paths
User interface:
* 4702 FIX: Quicksearch: fixed minor parsing issue when using specific filters
* 4746 FIX: Fixed using HW/SW inventory filters in views without inventory painters
Livestatus:
* 4430 FIX: Fixed logwatch-related Livestatus queries in NEB module
HW/SW inventory:
* 4568 FIX: mk_inventory.vbs: fixed getNetworkAdpater function to prevent errors caused by null arrays
Checks & agents:
* 4742 FIX: wmi_cpuload: Added required tables to prevent crash
* 4748 FIX: solaris_fmadm: Check was only discovered when an error is detected
* 4664 FIX: netapp_api_qtree_quota: Fixed NameError: name 'is_digit' is not defined
* 4740 FIX: mysql: Fixed crash if instance is not available anymore
* 4633 FIX: jolokia_metrics.uptime: No longer crash when agent info is incomplete
* 4739 FIX: hp_proliant_da_phydrv: Implemented new possible values
* 4632 FIX: fsc_subsystems: No longer crash when statuscode is missing
* 4743 FIX: f5_bigip_conns: Fixed crash if empty values
* 4741 FIX: dell_powerconnect_temp: Fixed missing reference for computing the temperature
* 4631 FIX: cisco_ace_rserver: Fix broken IP address parsing
NOTE: Please refer to the migration notes!
* 4663 FIX: check_mailboxes: Removed useless report_age which causes TypeError: float() argument must be a string or a number
* 4735 FIX: check_mailboxes: Fixed broken check when setting "connect timeout" option
* 4734 FIX: check_mail check_mail_loop check_mailboxes check_sql: Passwords from password store were not used correctly
REF: http://lists.mathias-kettner.de/pipermail/checkmk-announce/2017-May/000205.html
WATO:
* 4747 FIX: Fixed resetting global settings to factory defaults
* 4750 FIX: Ensure uploaded icons are saved with their filename instead of paths
User interface:
* 4702 FIX: Quicksearch: fixed minor parsing issue when using specific filters
* 4746 FIX: Fixed using HW/SW inventory filters in views without inventory painters
Livestatus:
* 4430 FIX: Fixed logwatch-related Livestatus queries in NEB module
HW/SW inventory:
* 4568 FIX: mk_inventory.vbs: fixed getNetworkAdpater function to prevent errors caused by null arrays
Checks & agents:
* 4742 FIX: wmi_cpuload: Added required tables to prevent crash
* 4748 FIX: solaris_fmadm: Check was only discovered when an error is detected
* 4664 FIX: netapp_api_qtree_quota: Fixed NameError: name 'is_digit' is not defined
* 4740 FIX: mysql: Fixed crash if instance is not available anymore
* 4633 FIX: jolokia_metrics.uptime: No longer crash when agent info is incomplete
* 4739 FIX: hp_proliant_da_phydrv: Implemented new possible values
* 4632 FIX: fsc_subsystems: No longer crash when statuscode is missing
* 4743 FIX: f5_bigip_conns: Fixed crash if empty values
* 4741 FIX: dell_powerconnect_temp: Fixed missing reference for computing the temperature
* 4631 FIX: cisco_ace_rserver: Fix broken IP address parsing
NOTE: Please refer to the migration notes!
* 4663 FIX: check_mailboxes: Removed useless report_age which causes TypeError: float() argument must be a string or a number
* 4735 FIX: check_mailboxes: Fixed broken check when setting "connect timeout" option
* 4734 FIX: check_mail check_mail_loop check_mailboxes check_sql: Passwords from password store were not used correctly
REF: http://lists.mathias-kettner.de/pipermail/checkmk-announce/2017-May/000205.html
2017年5月23日 星期二
2017 SAP Forum Taipei
- digital supply chain connected to everything
- changing and reinventing
- real-time BI decision
- if you can't measure it, you can't improve it.
- enterprise level data warehouse
- design thinking
- system for log, for engagement, for innovation
- people, thing, business
- reinvent, reimagine, and four other R
- SAP edge computing filtered then send to cloud, IoT foundation
- Digital Twin
- predictive maintenance management
2017年5月17日 星期三
Custom Snort Rules
For example, this specifies a logical message whenever Snort notices
any traffic that is sent from 192.168.1.35:
alert tcp 192.168.1.35 any -> any any (msg:"Traffic from 192.168.1.35";)
REF: http://archive.oreilly.com/pub/h/1393
2017年5月9日 星期二
Check_MK: Windows mapped drives
philipp.bieber at gildemeister.com [21.08.2013 08:53]:
> Hi James,
> the problem is (probably) that the check_mk agent is run under the LOCAL
> SYSTEM Account, which has no access to those mapped drives.
> You can either go with Bill's proposal and use legacy checks, or you may
> look into creating a custom SNMP check to get the quotas of your EMC...
> ( -> http://mathias-kettner.de/checkmk_devel_snmpbased.html )
>
> We did something similar with our NetApps....

Maybe you can create a batch file that mounts all the shares. Then you
tell your system to mount them as SYSTEM during startup.

We had to do this for one server, and it works fine. A description can
be found on
<http://social.technet.microsoft.com/Forums/windowsserver/en-US/44445dc3-0185-407f-b8ad-711f22cd4ec6/windows-nfs-client-reconnect-to-nfs-target-on-reboot>
(it works with non-nfs shares as well).

HTH, Werner
2017年5月4日 星期四
Check_MK: Agents
Check_MK agent consumes very few resource since they are only small scripts parsing system info. But remember that if the parsed resource such as log files are too large, agent performance will be affected. This can be monitored by agent execution time graph.
The check_mk agent for Linux consists of only two files: a shell skript called check_mk_agent.linux and a configuration file for xinetd.conf, both of which can be found in the subdirectory agents. xinetd is an improved version of the classical inetd and a is available or even standard on most current linux distributions.
REF: https://mathias-kettner.de/checkmk_linuxagent.html
The check_mk agent for Linux consists of only two files: a shell skript called check_mk_agent.linux and a configuration file for xinetd.conf, both of which can be found in the subdirectory agents. xinetd is an improved version of the classical inetd and a is available or even standard on most current linux distributions.
REF: https://mathias-kettner.de/checkmk_linuxagent.html
訂閱:
文章 (Atom)